Revision history [back]

A vital question and suddenly my experience will help. :)
Will be required:
I used to use two OS commands
- gprof2dot -o s.res -f pstats .prof
- c:\Program Files (x86)\Graphviz2.38\bin\dot.exe -Tpng -Tps s.res -o CreateBasemain.png
Now use DebugProfileTools
from DebugProfileTools import (profile)
....
some code
....
@profile def Create(): .... the profiled function. This is usually main ....
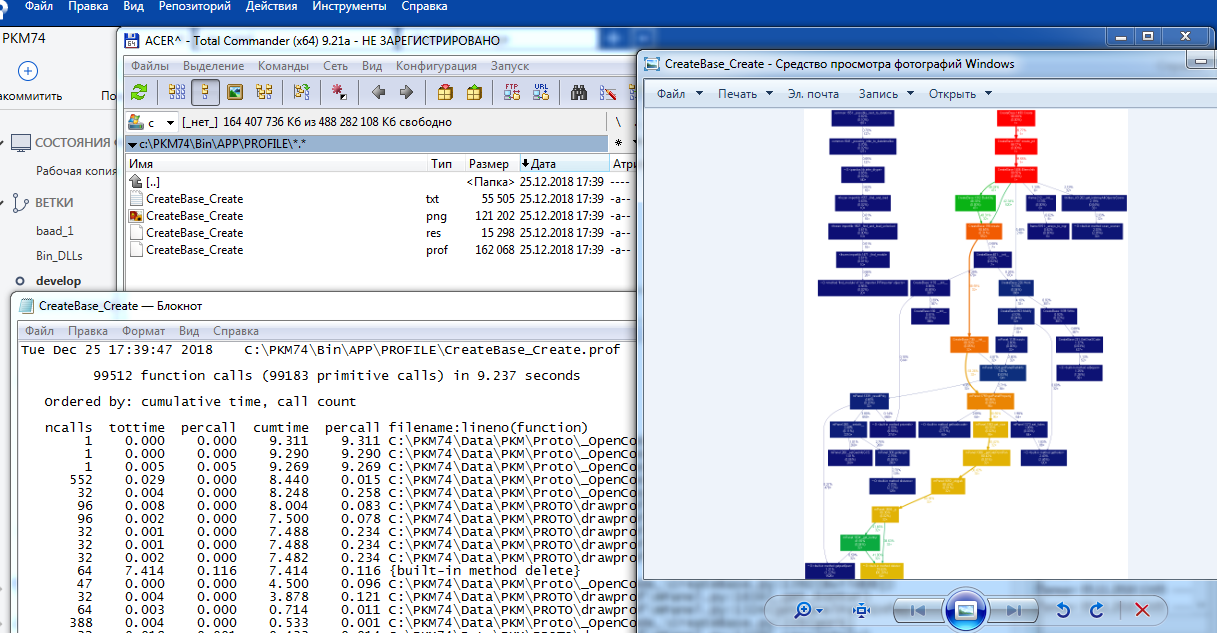
Below are the profiling results of a module CreateBase.
Each subsequent call overwrites the previous not at coincidence of names, and creates the index file in parentheses.
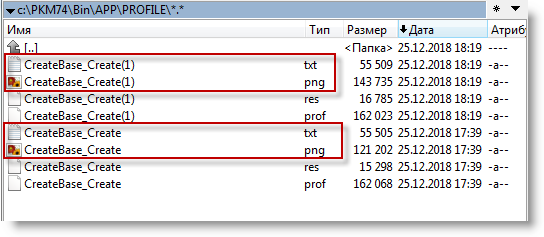
*.prof file the result of the Profiler, cProfile
*.res graph-reading assignment utility Graphviz prepared gprof2dot
*.png graph-a picture of function calls
*.txt report in text form
A vital question and suddenly my experience will help. :)
Will be required:
I used to use two OS commands
Now use DebugProfileTools
from DebugProfileTools import (profile)
....
some code
....
@profile def Create(): .... the profiled function. This is usually main ....
Below are the profiling results of a module CreateBase.
Each subsequent call overwrites the previous not at coincidence of names, and creates the index file in parentheses.
*.prof file the result of the Profiler, cProfile
*.res graph-reading assignment utility Graphviz prepared gprof2dot
*.png graph-a picture of function calls
*.txt report in text form