First time here? Check out the FAQ!
1

Graphical Profiler
 

Is integration with a profiler scheduled for a future release? Example

https://www.youtube.com/watch?v=QSueV...

To enter a block of code:

  • enter empty line after your previous text
  • paste or type the code
  • select the code and press the button above
Preview: (hide)
Ken D's avatar
11
Ken D
asked 6 years ago
Wingware Support's avatar
4.2k
Wingware Support
updated 6 years ago

Comments

see more comments

2 Answers

0

It's on our list of features we'ld like to add but I'm not yet sure when we'll get to it.  This and code coverage are fairly high on that list.

To enter a block of code:

  • enter empty line after your previous text
  • paste or type the code
  • select the code and press the button above
Preview: (hide)
Wingware Support's avatar
4.2k
Wingware Support
answered 6 years ago
link

Comments

Any update on the "code coverage" support?

Joril's avatar Joril (3 years ago)

We've not started on this yet. We're still working on Wing 8 but are starting to look at priorities for Wing 9.. This is on the list but no final decisions have been made yet about what is going into Wing 9, and in what order. Sorry... that's all we know so far. Note that of course there's nothing preventing use of coverage.py or similar along with Wing. There's just no integrated support yet.

Wingware Support's avatar Wingware Support (3 years ago)
see more comments
0

A vital question and suddenly my experience will help. :)

Will be required:

  • Graphviz desirable (2.38)

  • gprof2dot If the question is what is it, then we take it here

I used to use two OS commands

  • gprof2dot -o s.res -f pstats <fulname>.prof
  • c:\Program Files (x86)\Graphviz2.38\bin\dot.exe -Tpng -Tps s.res -o CreateBasemain.png

Now use DebugProfileTools

from DebugProfileTools import (profile)

....

some code

....

@profile def Create(): .... the profiled function. This is usually main ....

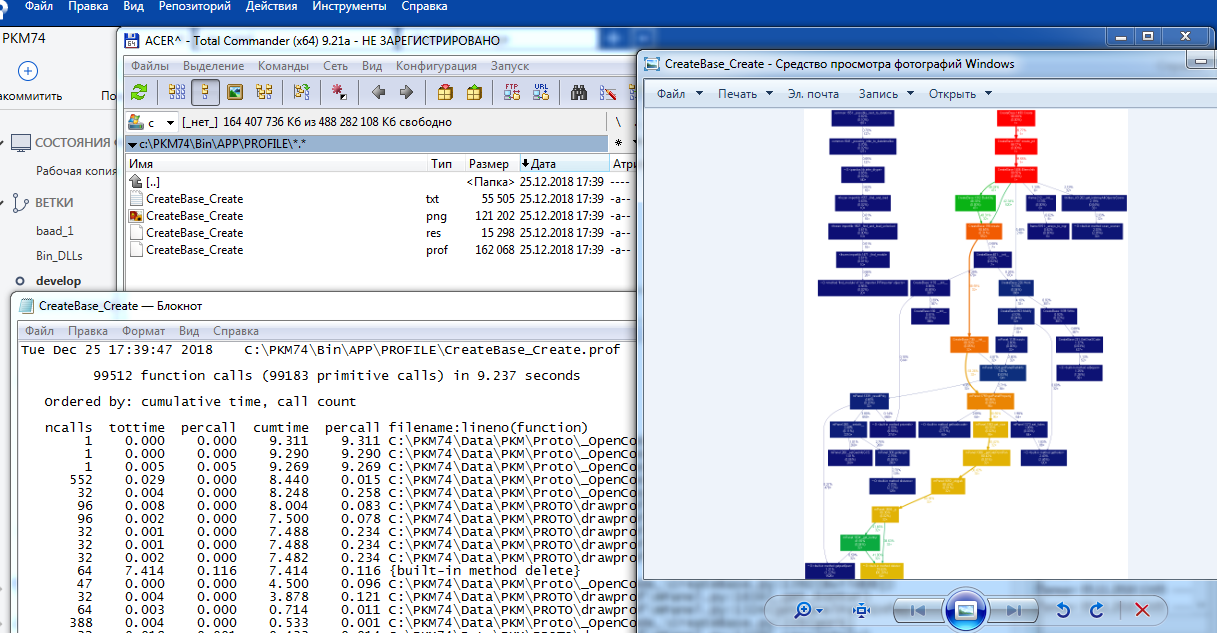
Below are the profiling results of a module CreateBase.

Each subsequent call overwrites the previous not at coincidence of names, and creates the index file in parentheses.

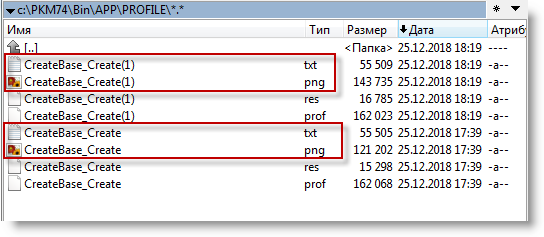
*.prof file the result of the Profiler, cProfile *.res graph-reading assignment utility Graphviz prepared gprof2dot *.png graph-a picture of function calls *.txt report in text form

To enter a block of code:

  • enter empty line after your previous text
  • paste or type the code
  • select the code and press the button above
Preview: (hide)
Alexander_Dragunkin's avatar
38
Alexander_Dragunkin
answered 5 years ago, updated 5 years ago
link

Comments

see more comments

Your Answer

Please start posting anonymously - your entry will be published after you log in or create a new account. This space is reserved only for answers. If you would like to engage in a discussion, please instead post a comment under the question or an answer that you would like to discuss.

Add Answer

To enter a block of code:

  • enter empty line after your previous text
  • paste or type the code
  • select the code and press the button above
Preview: (hide)