First time here? Check out the FAQ!
1

Compared to PyCharm, Wing's "Stack Data" can only provide very limited data.

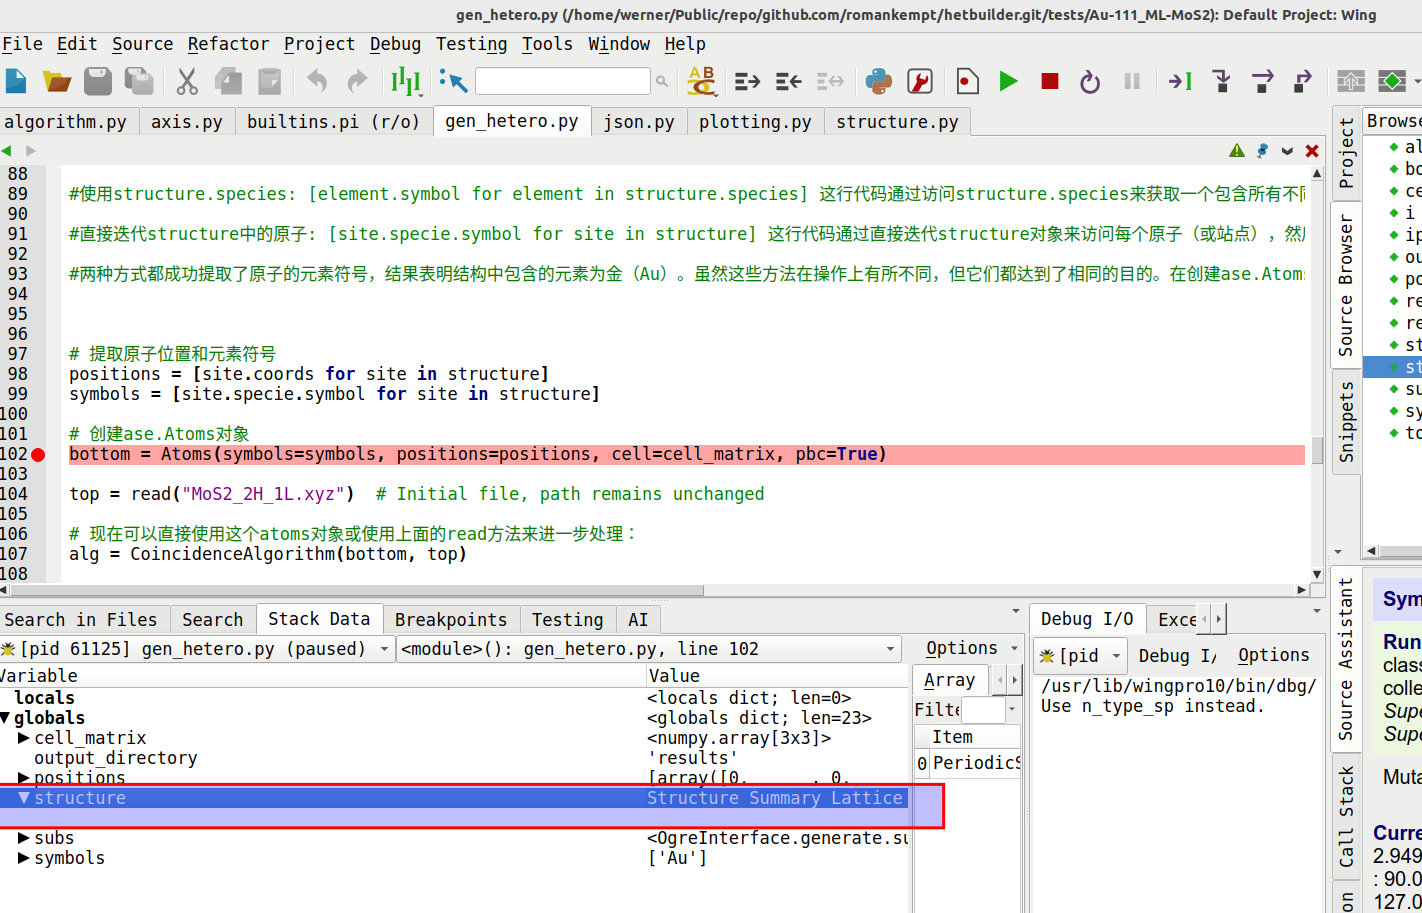
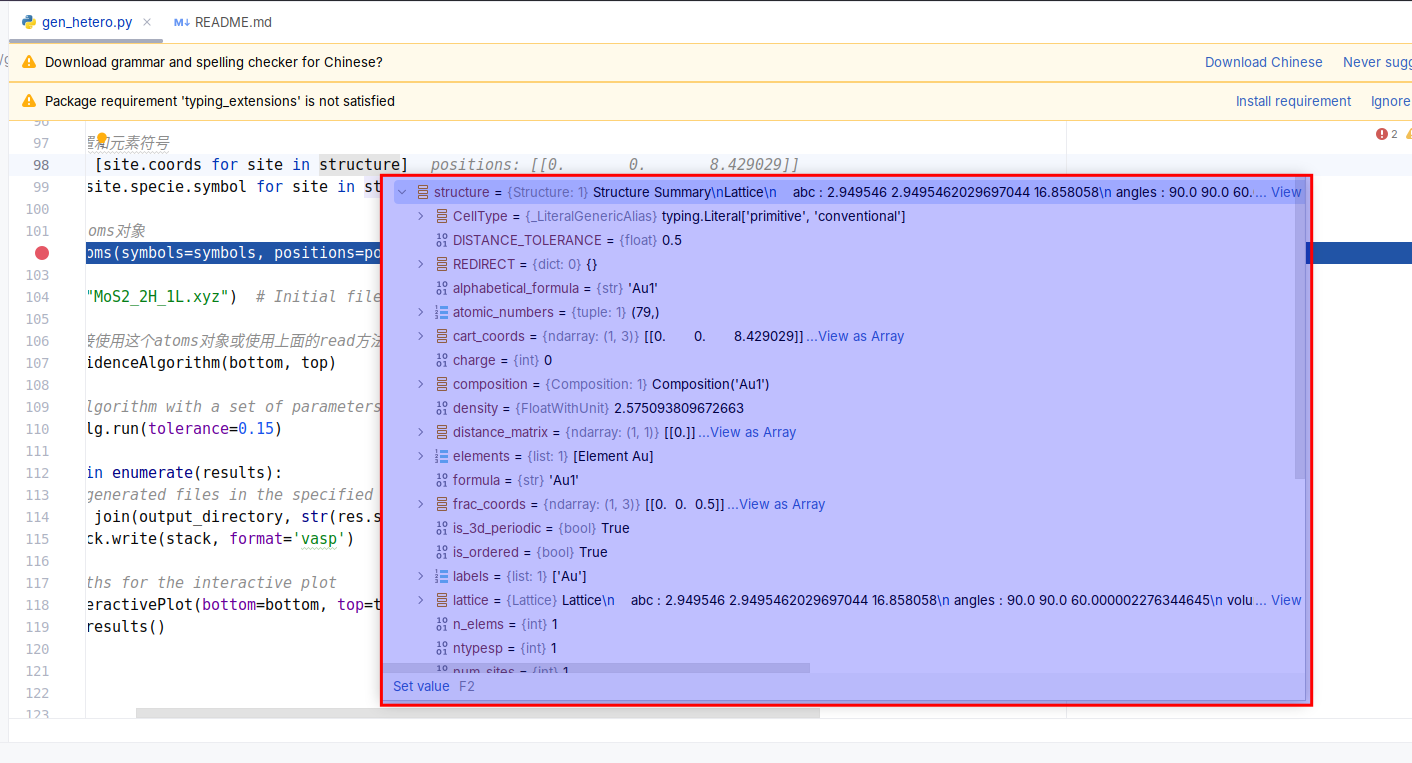
When running this script in pycharm and wing, I see very limited information in debug mode for the "structure" in wing compared to the debug data I saw on PyCharm, as shown below:

In wing:

image description

In pycharm:

image description

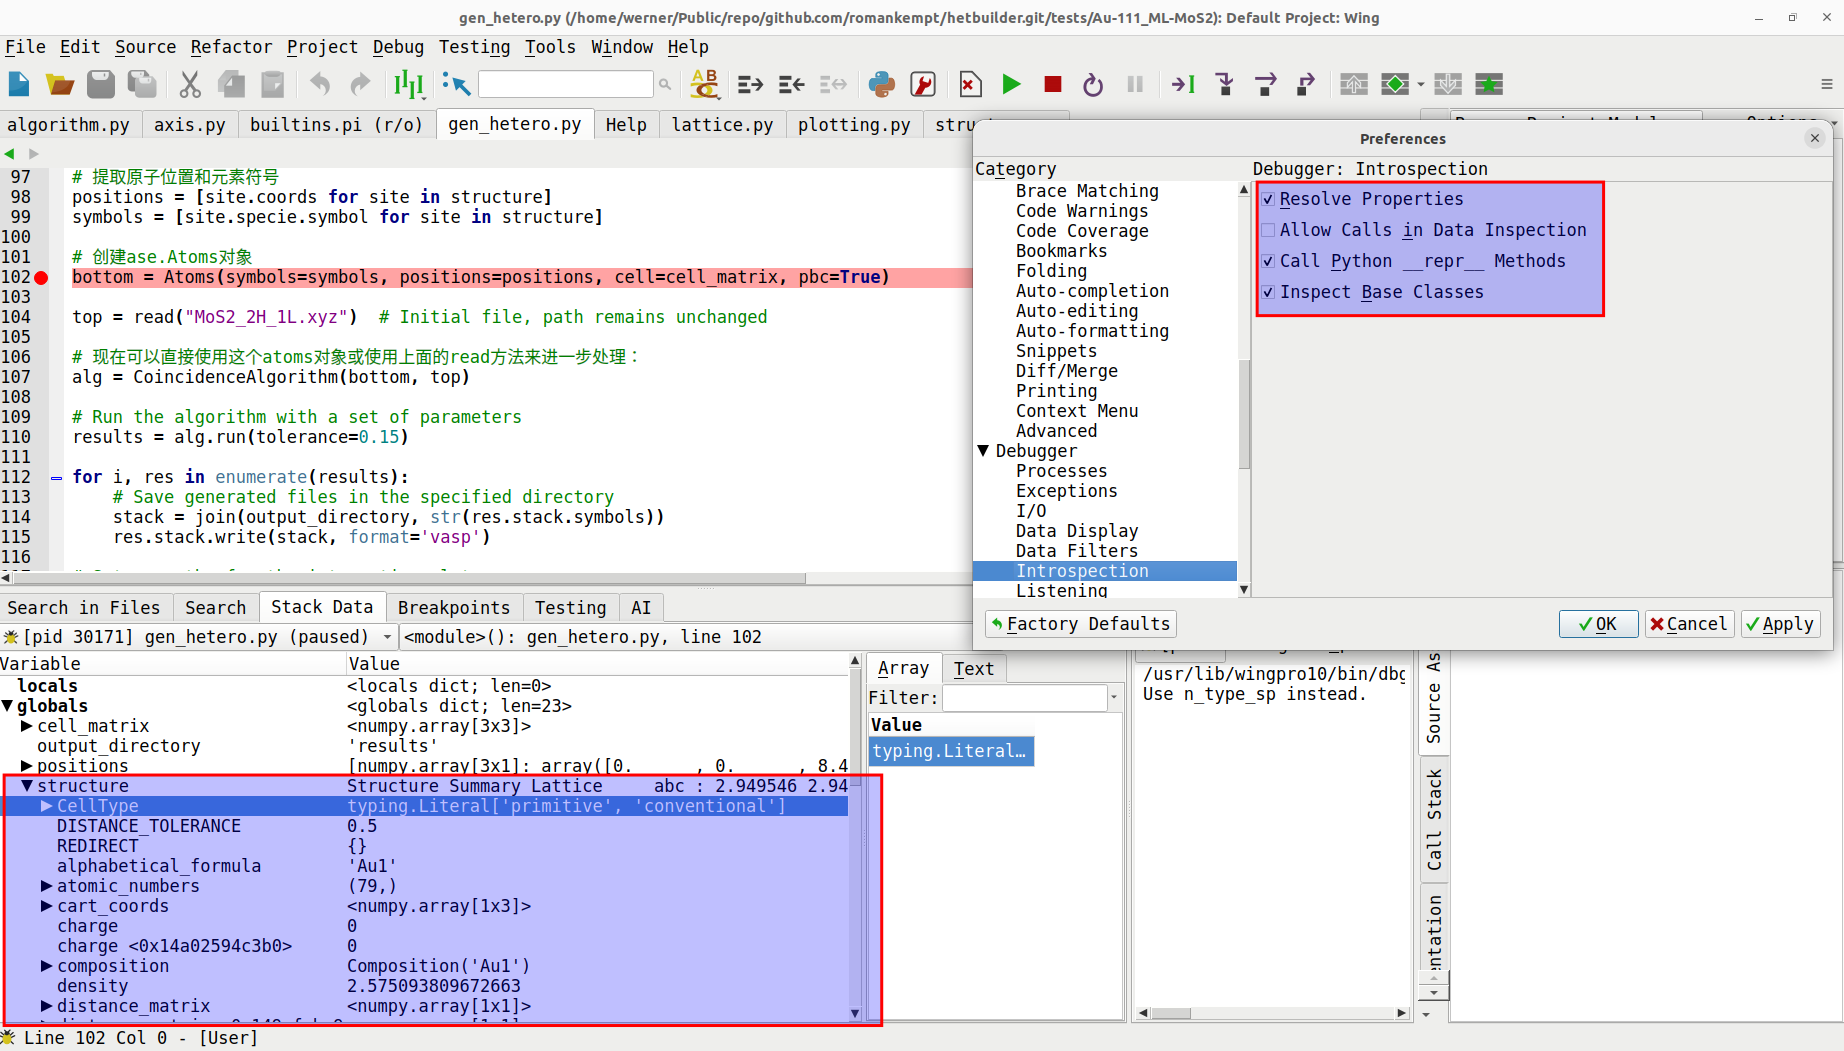
So, how can I see the same rich debugging data in wing?

Regards, Zhao

hongyi-zhao's avatar
507
hongyi-zhao
asked 2024-03-02 09:24:47 -0500
edit flag offensive 0 remove flag close merge delete

Comments

add a comment see more comments

2 Answers

1

I tried combinations of different options and found that the following options can largely achieve the effect of PyCharm:

image description

hongyi-zhao's avatar
507
hongyi-zhao
answered 2024-03-02 19:11:51 -0500, updated 2024-03-02 19:24:48 -0500
edit flag offensive 0 remove flag delete link

Comments

add a comment see more comments
0

Try enabling some of the disabled-by-default options on the Debugger > Introspection page. I'd try one at a time since these can cause problems because they execute actual Python code to get values. You'll need to restart debugging for the option changes to take effect.

A lot of Python debuggers do that by default but Wing doesn't because we prefer to avoid crashing or hanging up when there's buggy code involved. Also, in Wing you can always use the Debug Console to inspect values you're interested in if they aren't complete in the Stack Data tool.

Please let me know if that doesn't help.

Wingware Support's avatar
4k
Wingware Support
answered 2024-03-02 14:27:47 -0500
edit flag offensive 0 remove flag delete link

Comments

add a comment see more comments

Your Answer

Please start posting anonymously - your entry will be published after you log in or create a new account. This space is reserved only for answers. If you would like to engage in a discussion, please instead post a comment under the question or an answer that you would like to discuss.

Add Answer